* iiris / ECE 499
ECE 499 · Design Project II University of Victoria Electrical & Computer Engineering August 2026

hot

Finding the heat a building should not be losing.

Infrared Image Recognition and Iterative Supervision (IIRIS)

A deep-learning framework that automatically detects and segments thermal anomalies (missing insulation, thermal bridges and air leakage) in infrared thermograms of building envelopes, paired with a web application that puts the model in the hands of the people doing the audit.

89.8% mAP@50
95.8% Recall
6 Defect classes
357 Expert polygons
01 / About the team

*the team

Two fourth-year Electrical & Computer Engineering students at the University of Victoria, working at the intersection of computer vision and building science.

John Soliman

Detection capability · Delivery platform

Dataset curation and the augmentation pipeline; YOLOv11n-seg training and hyperparameter configuration; the Flask web application, covering the inference interface, the annotation canvas and YOLO label export; and deployment and containerization. Together these deliver the core detection capability and the platform through which end users reach it.

  • YOLOv11
  • PyTorch
  • Flask
  • Deployment

Yunu Choe

Statistical credibility · Scholarly grounding

The literature survey; annotation verification and dataset quality assurance; the validation experiments, comprising the augmentation ablation study and the 5-fold cross-validation protocol; and results analysis and report preparation. Together these underwrite the statistical credibility of the reported metrics and the grounding of the design choices.

  • Validation
  • Dataset QA
  • Literature survey
  • Analysis
University of Victoria crest

Department of Electrical and Computer Engineering, University of Victoria · Course project for ECE 499: Design Project II (Capstone), completed in collaboration with the Department of Civil Engineering's building envelope research group.

02 / Background

*the
problem

Buildings leak energy through their envelopes, and the inspections meant to catch it are slow, manual and inconsistent. That gap is where wasted energy lives, and wasted money with it.

Reducing residential and commercial energy loss starts with knowing where it goes. A substantial portion of a building's energy loss escapes through the building envelope, driven by compromised structural integrity, degrading insulation, thermal bridges, and unintended air infiltration. Detecting these failure modes is a prerequisite for accurate energy-loss calculation and for targeting retrofits where they will actually pay off.

Infrared thermography (IRT) is the established tool for the job. It is a non-destructive testing method: by capturing emitted infrared radiation, a thermal camera makes heat-transfer anomalies visible that the naked eye cannot see, with no drilling, no demolition and no disruption to occupants.

But reading a thermogram is still a human bottleneck. Manual interpretation is subjective, depends heavily on the individual inspector's expertise, and does not scale across large infrastructure portfolios such as a university campus, a school district, or a municipality's building stock. Two auditors can look at the same image and disagree on what qualifies as a defect, and a single missed anomaly translates directly into energy that keeps being wasted, year after year.

The social stake. Energy retrofits are one of the most direct levers communities have for cutting building emissions and utility bills, but public agencies and homeowners can only act on what an audit actually finds. Making that audit faster, cheaper, more consistent and less dependent on scarce expert time widens who can benefit from it.

  • 01

    Subjective diagnosis

    Interpretation depends on inspector expertise, so the same façade can yield different findings from different auditors.

  • 02

    Doesn't scale

    Manual review of thermograms is time-consuming, which limits how much of a building portfolio can realistically be assessed.

  • 03

    Missed defects cost energy

    A false negative in an energy audit is not a rounding error. It is an unaddressed loss that persists for the life of the assembly.

  • 04

    Classical automation is brittle

    Threshold- and gradient-based algorithms are sensitive to environmental conditions, reflective surfaces and thermal noise.

Make the diagnosis repeatable, and the retrofit becomes defensible.
03 / Design

*the
approach

An end-to-end pipeline: capture thermograms on campus, have a domain expert annotate them at pixel level, augment aggressively to survive a small dataset, train a lightweight instance-segmentation network, and hand the result back to human auditors through a web app that learns from their corrections.

  1. Step 01

    Capture

    24 high-resolution thermograms of UVic building façades, shot with a FLIR A65 under varied thermal loading conditions.

  2. Step 02

    Expert annotation

    357 polygon boundaries across 6 classes, defined by a building-envelope domain expert rather than by the student team alone.

  3. Step 03

    Augment

    A 10× Albumentations pipeline (flips, rotation, affine and radiometric jitter) expanding the corpus to 240 training images.

  4. Step 04

    Train

    YOLOv11n-seg, the nano instance-segmentation variant, trained for 100 epochs at 640×640 with overlap_mask=False.

  5. Step 05

    Deploy & relearn

    A Flask web app for live inference, plus an annotation canvas that exports expert corrections straight back into YOLO format.

Dataset & classes

The original dataset comprises 24 high-resolution thermal images captured with a FLIR A65 thermal camera, a 640 × 512 focal-plane-array microbolometer with ±5 °C accuracy, imaging a variety of building façades under different thermal loading conditions. Every image was manually annotated with polygon boundaries so that defects are delineated spatially, not just boxed. A total of 357 annotations span six classes.

  • Thermal bridge
  • Missing insulation
  • Air leakage
  • Window baseline
  • Spandrel
  • Vent

The first three are anomalies; the last three are structural references that give the network context for what a normal façade element looks like. Data was split 85% training / 15% validation with a pseudo-random image-level shuffle (seed = 42).

Model & training configuration

YOLOv11n-seg (nano variant) was selected deliberately: it uses Cross Stage Partial (CSP) networks with a Path Aggregation Network (PANet) for multiscale feature fusion, which matters because thermal defects vary enormously in scale, while keeping a computational footprint small enough for eventual edge deployment. The segmentation head combines box loss, focal classification loss and a binary cross-entropy mask loss.

Hyperparameter Value Purpose
Input resolution640 × 640Standardized training dimensions
Batch size32Images per gradient update
Epochs / patience100 / 20Early stopping to retain the best weights
lr0 / lrf0.01 / 0.01Initial and final learning-rate scalars
Momentum0.937Gradient descent velocity
Weight decay0.0005L2 regularization against overfitting
Warmup epochs3.0Momentum / bias warmup phase
Box / cls / DFL loss7.5 / 0.5 / 1.5Loss-term weighting
Overlap maskFalseAllows physically overlapping instances
HardwareNVIDIA RTX 5090Training GPU

Setting overlap_mask=False matters physically: thermal anomalies bleed into structural elements (cold air leaking around a window pane occupies the same pixels as the window), so the network must be allowed to predict overlapping polygons instead of forcing one label per pixel.

The human-in-the-loop web framework

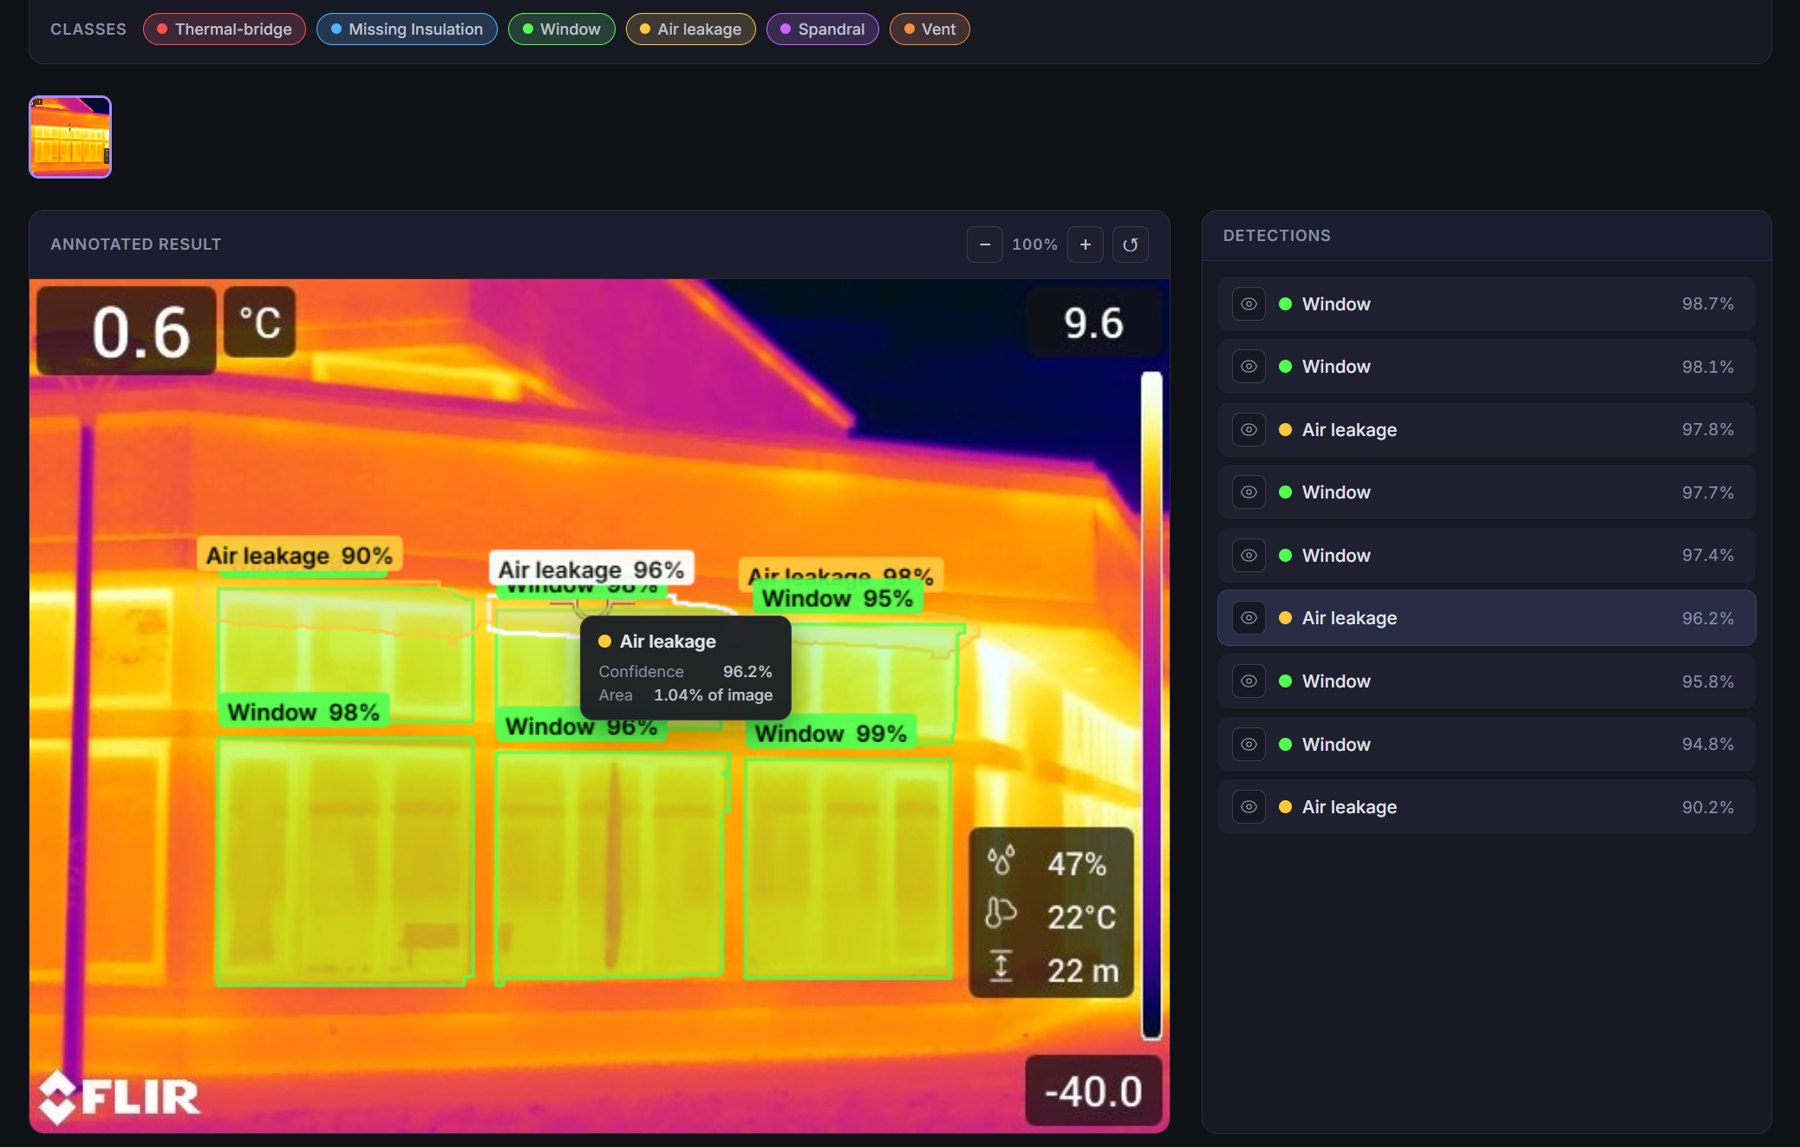
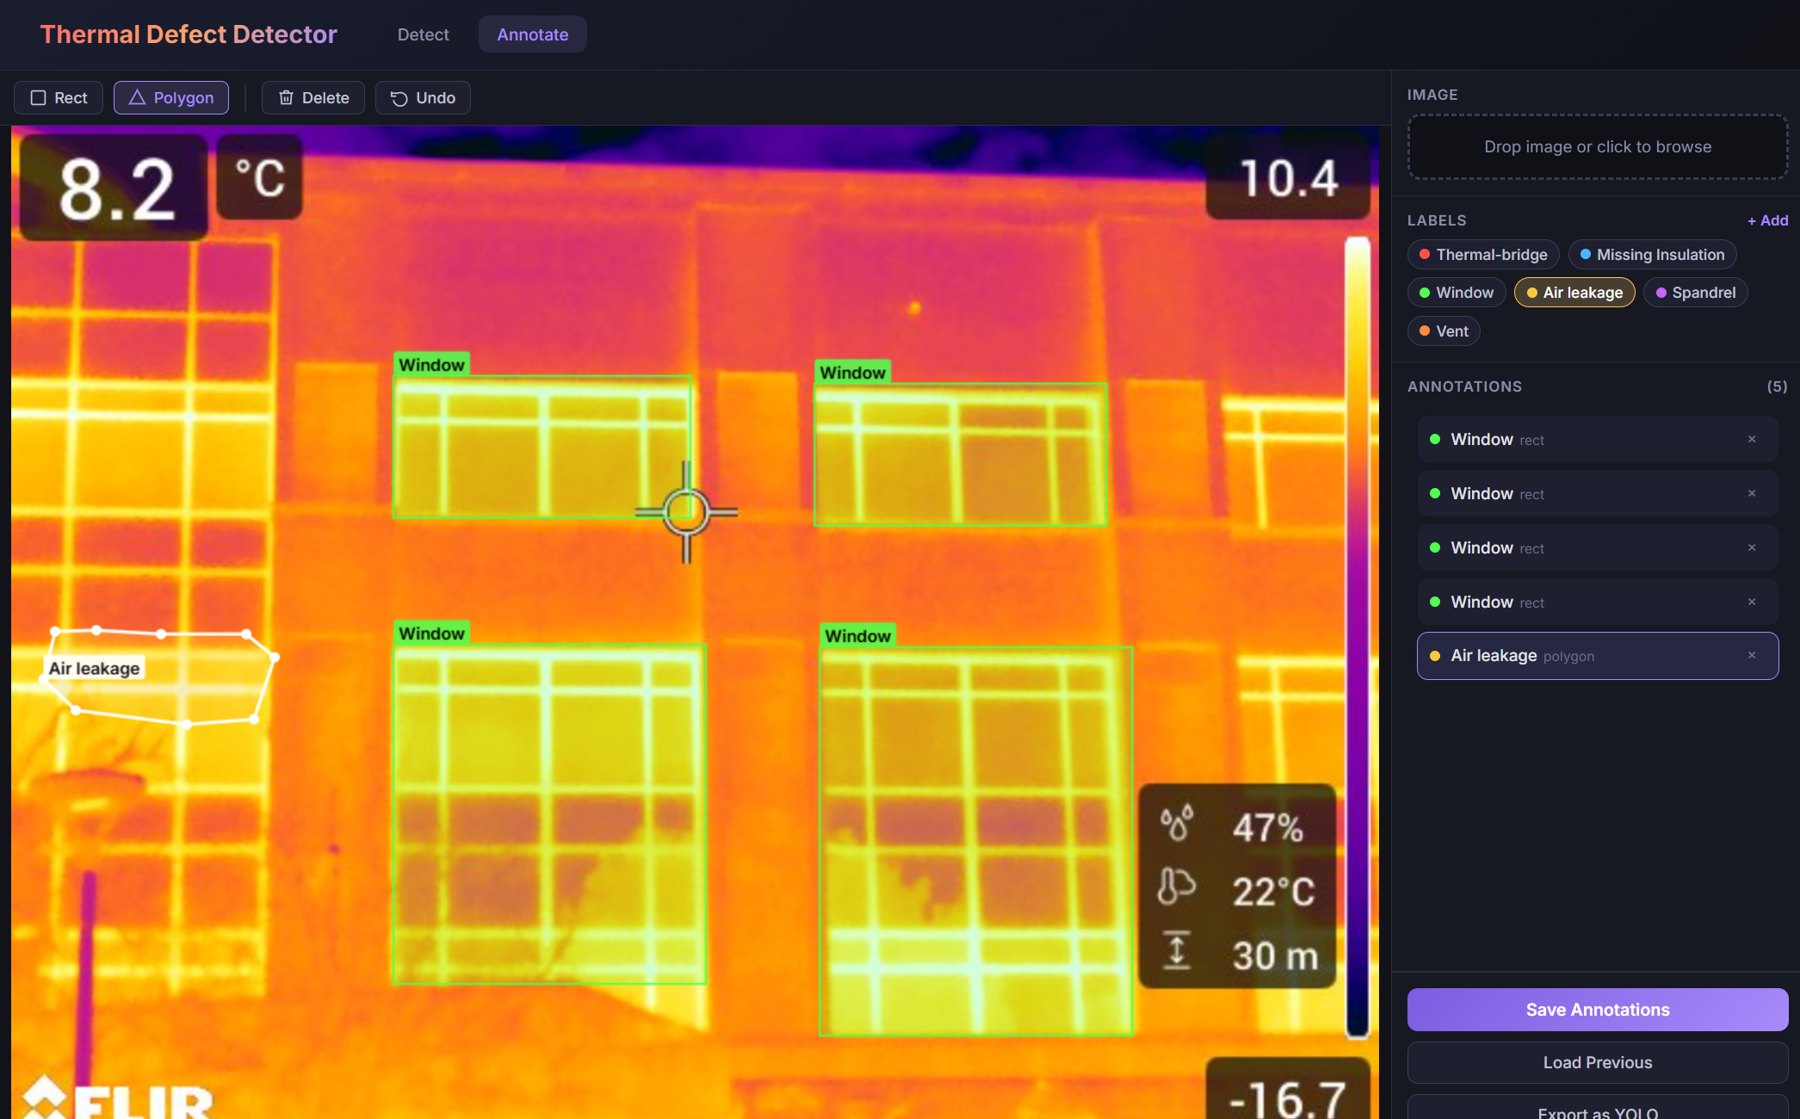
A model that only lives in a notebook doesn't change how audits are done. A companion Flask web application runs inference on raw thermal images with dynamic controls for confidence thresholding and per-class visibility, so a subtle low-confidence anomaly can be surfaced on demand rather than silently discarded by a fixed threshold. An integrated active-learning canvas then lets an expert correct any inaccurate polygon; those corrections are exported in YOLO annotation format, closing the loop for future retraining.

Web application detection interface showing segmented thermal anomalies with confidence controls
Fig. 1. Detection interface Real-time inference with adjustable confidence threshold and class visibility.
Active learning annotation canvas for correcting predicted polygons
Fig. 2. Active-learning canvas Experts correct predicted polygons; corrections export back to YOLO format.
04 / Results & findings

*the
numbers

Validation on the held-out 15% split, then two additional protocols designed to attack our own result: an augmentation ablation and a full 5-fold cross-validation.

89.8%
mAP@50
Mask mean average precision at IoU 0.50
95.8%
Recall
Low false-negative rate, few defects missed
87.0%
Precision
Proportion of detections that are real
66.7%
mAP@50–95
Averaged across stricter IoU thresholds

Against the targets we set

The project set numeric acceptance criteria up front rather than reporting whatever the model happened to produce. Both headline targets were exceeded, and all five test plans passed with none descoped.

Test Target Achieved Result
T1 Validation metricsmAP@50 ≥ 85%89.84%Pass
T1 Validation metricsRecall ≥ 90%95.79%Pass
T2 Augmentation ablationAugmented model superiorSuperior on every metricPass
T3 5-fold cross-validationLow variance across folds±0.52% on mAP@50Pass
T4 Qualitative comparisonPredictions match expert truthConsistent, tighter boundariesPass
T5 Web applicationLossless YOLO exportMerged back into training setPass

Recall is the metric that matters most here. In non-destructive testing, a missed defect corresponds directly to an unaddressed energy loss, so a framework that occasionally flags something benign is far preferable to one that quietly skips a failing wall assembly. At 95.79% recall, the model rarely misses. The mAP@50 of 89.84% indicates that segmentation stays consistent even across low-contrast thermal boundaries, which is exactly where hand-tuned thresholding methods fail.

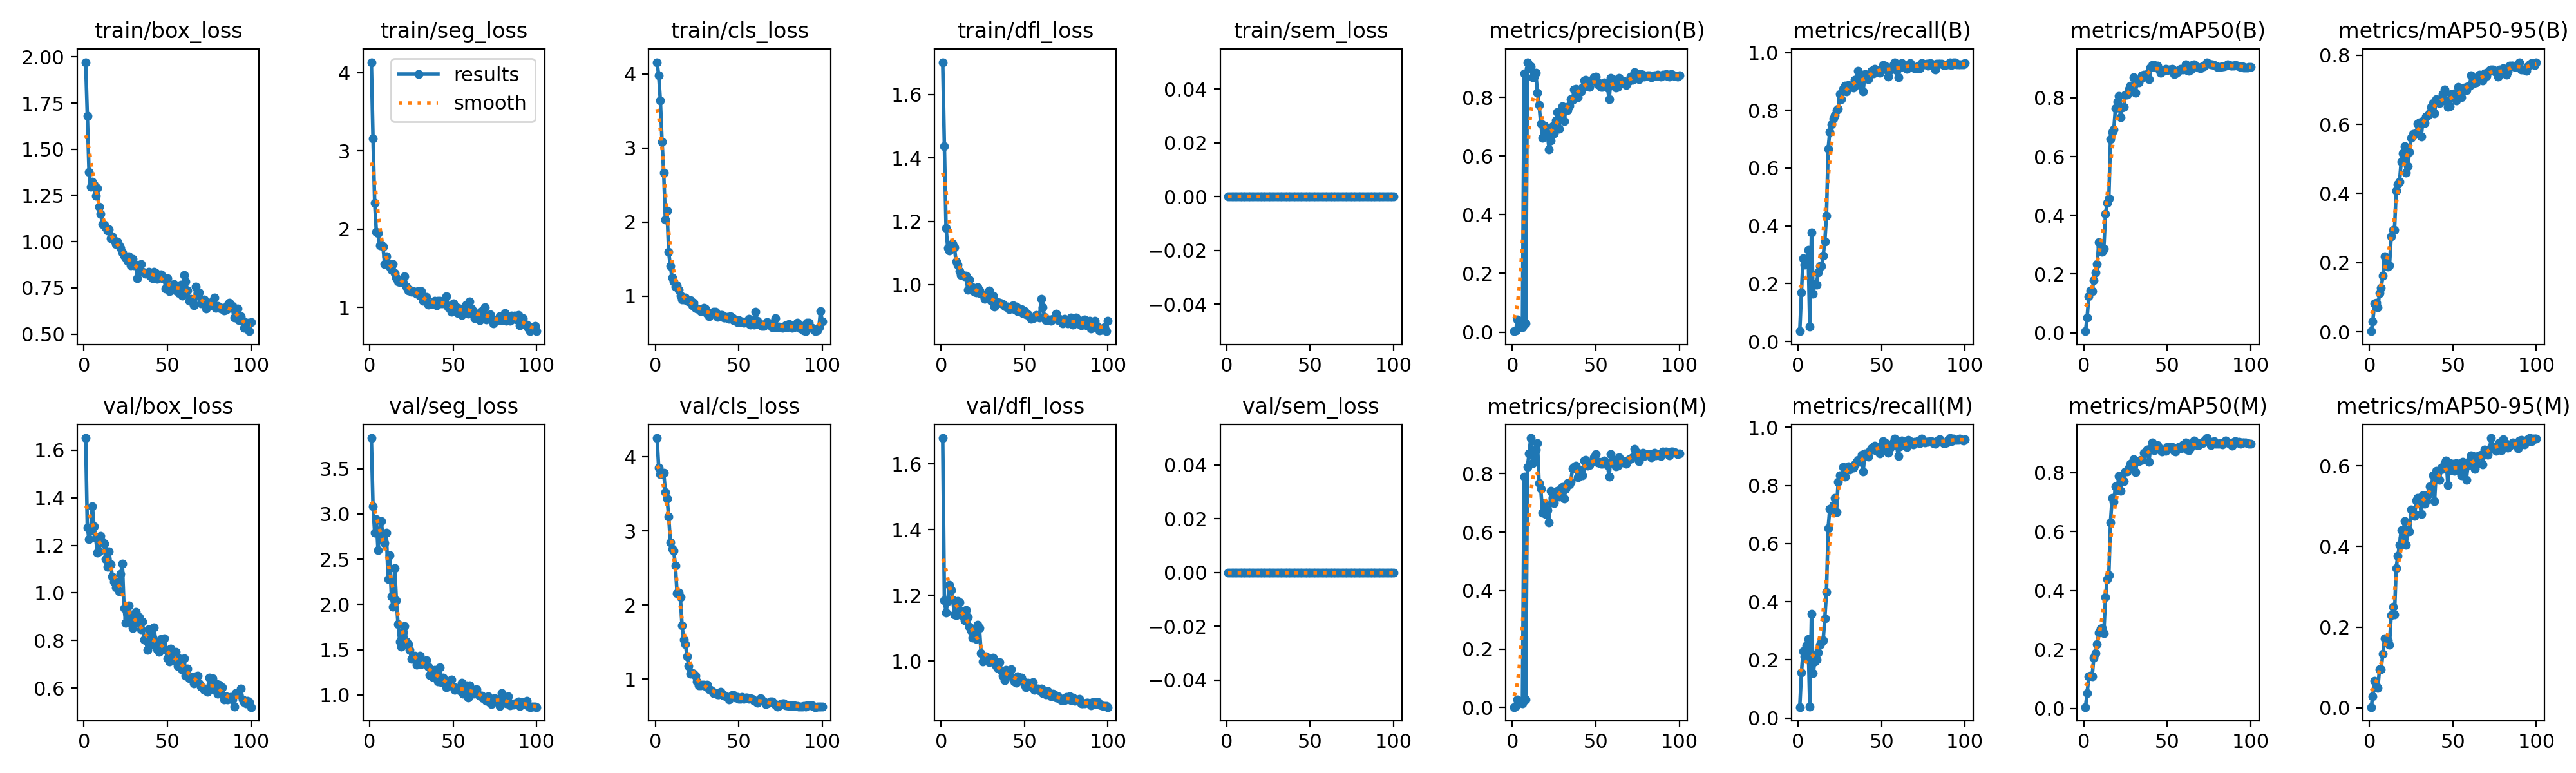
Training was stable: box loss fell from 1.97 to 0.56, and validation curves showed no divergent behaviour, suggesting the augmentation strategy was sufficient to hold off overfitting given the network's capacity.

Training and validation loss curves with precision and recall convergence over 100 epochs
Fig. 3. Training dynamics Loss curves and precision/recall convergence across 100 epochs.
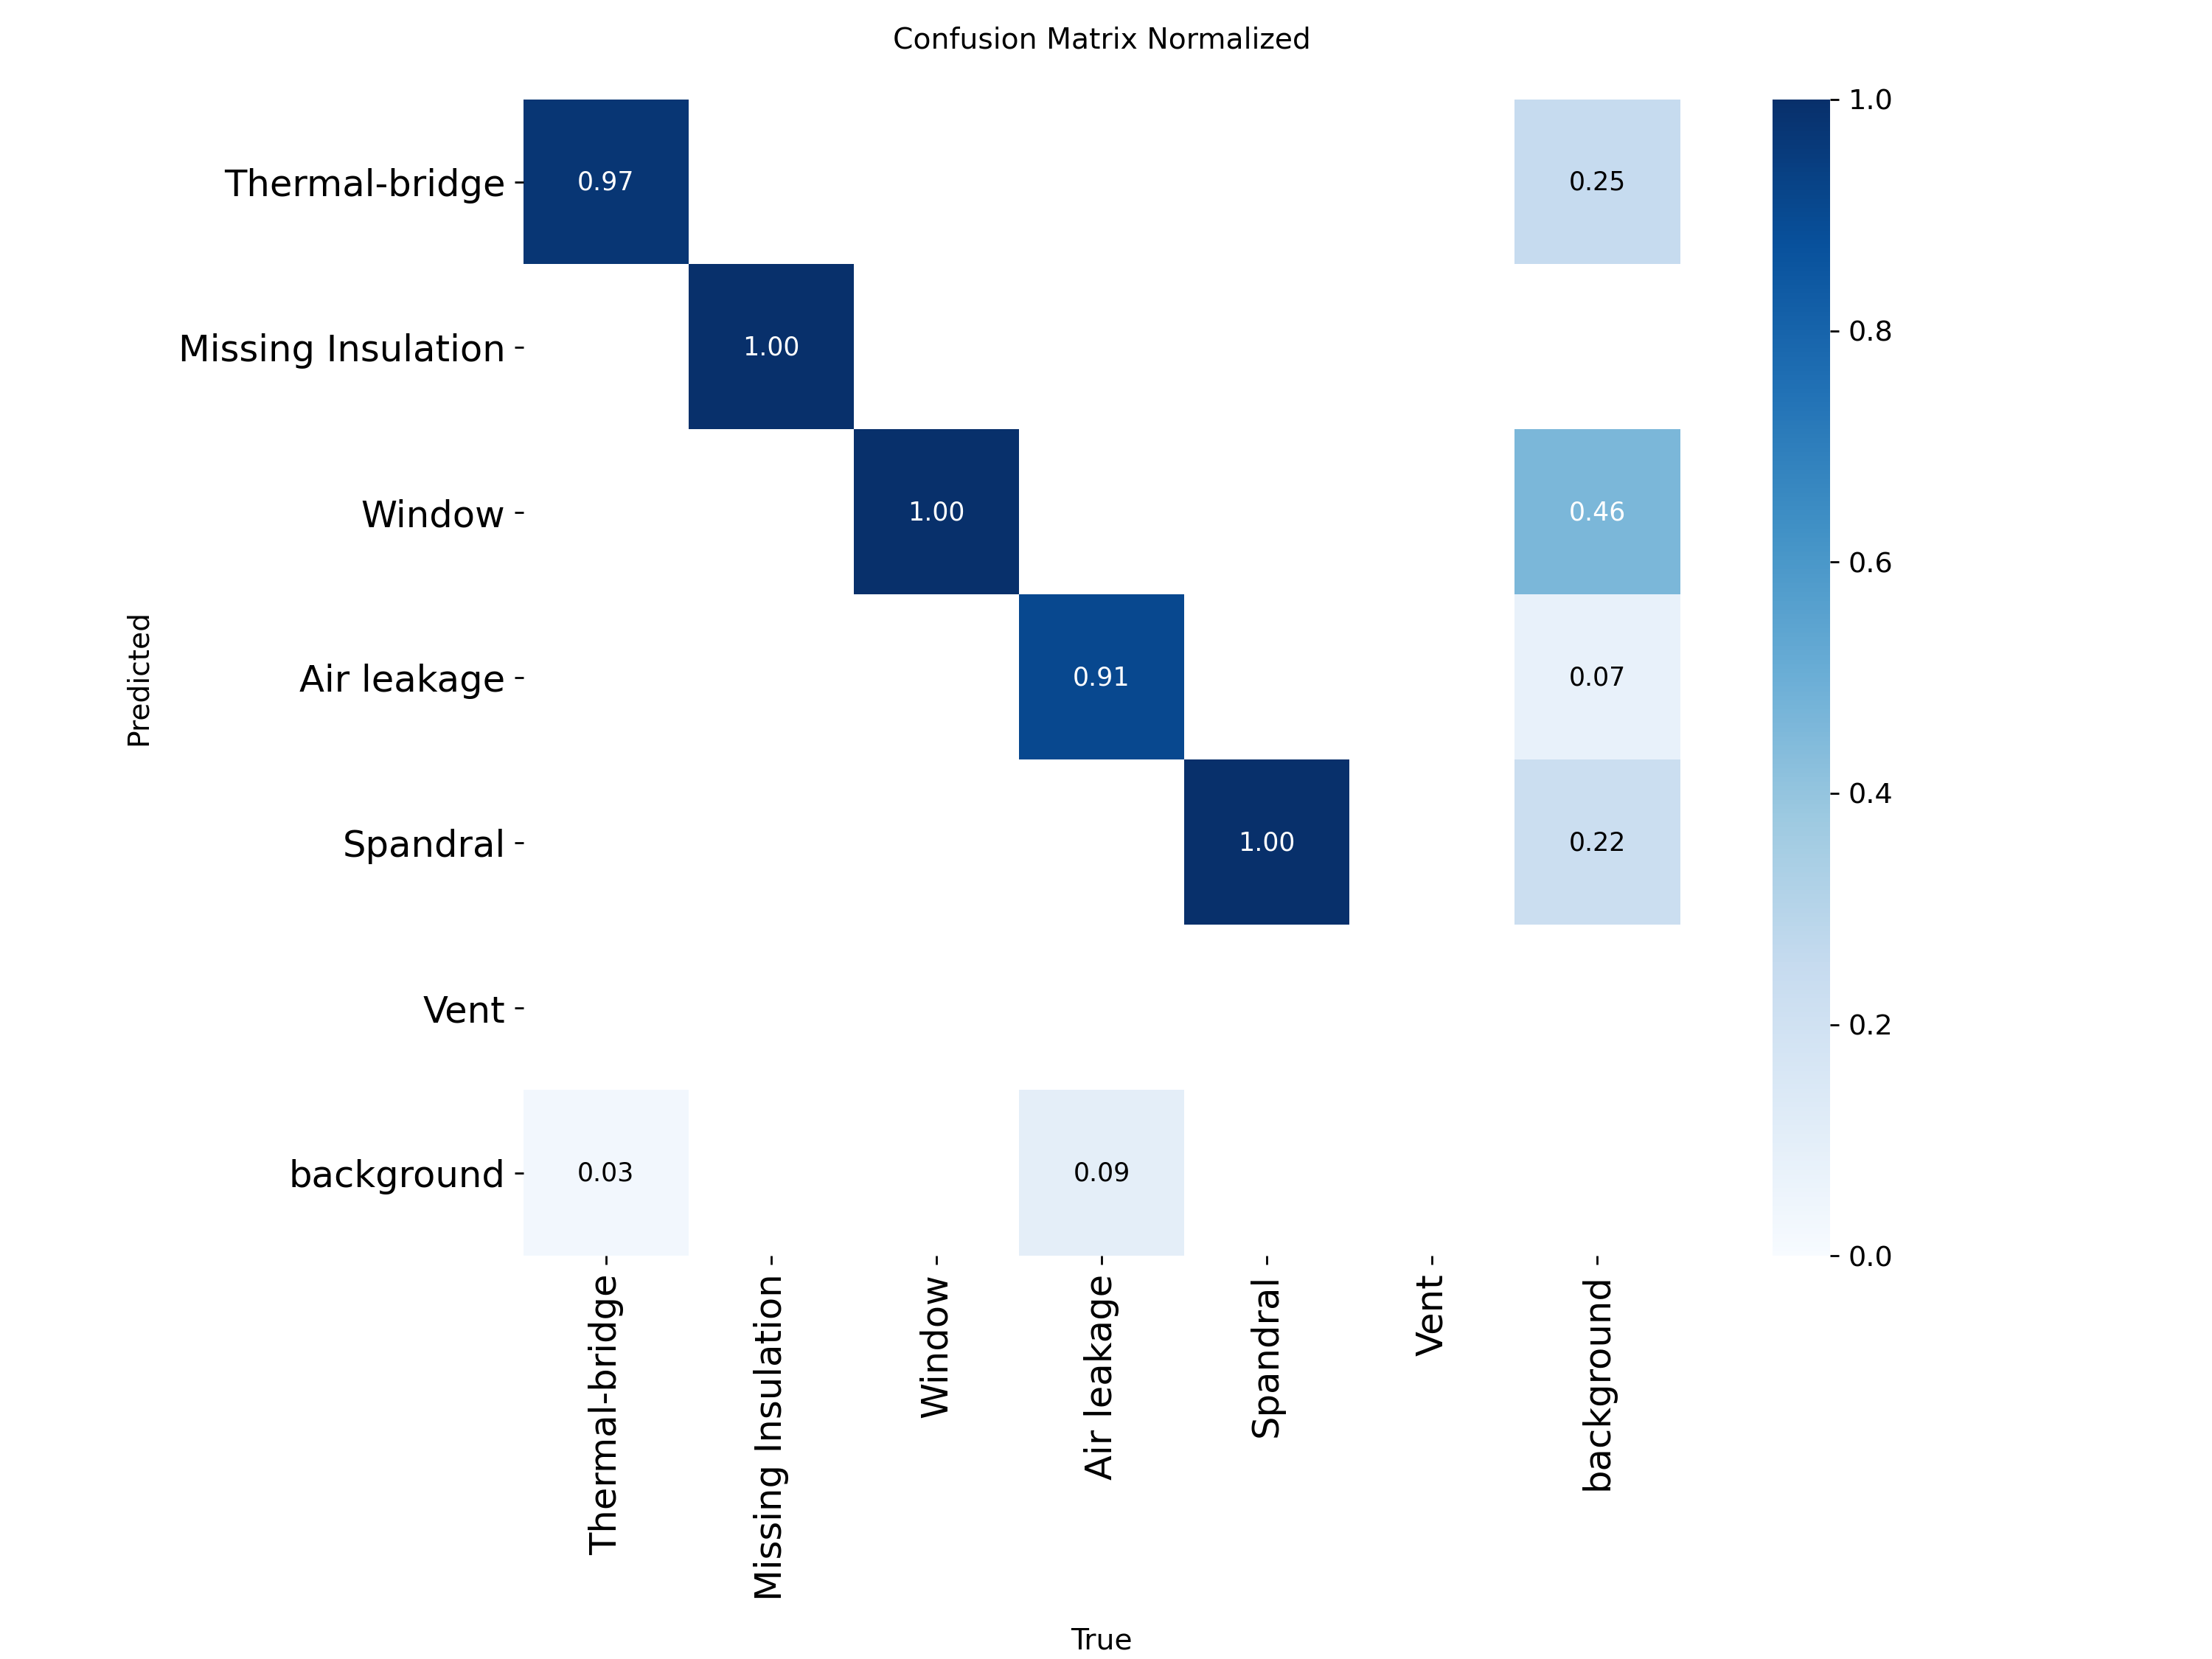
Normalized confusion matrix of class-wise prediction accuracy
Fig. 4. Normalized confusion matrix High true-positive rates for prevalent classes; residual confusion sits at thermodynamic boundaries between structurally adjacent features.
Mask precision-recall curve across all six classes
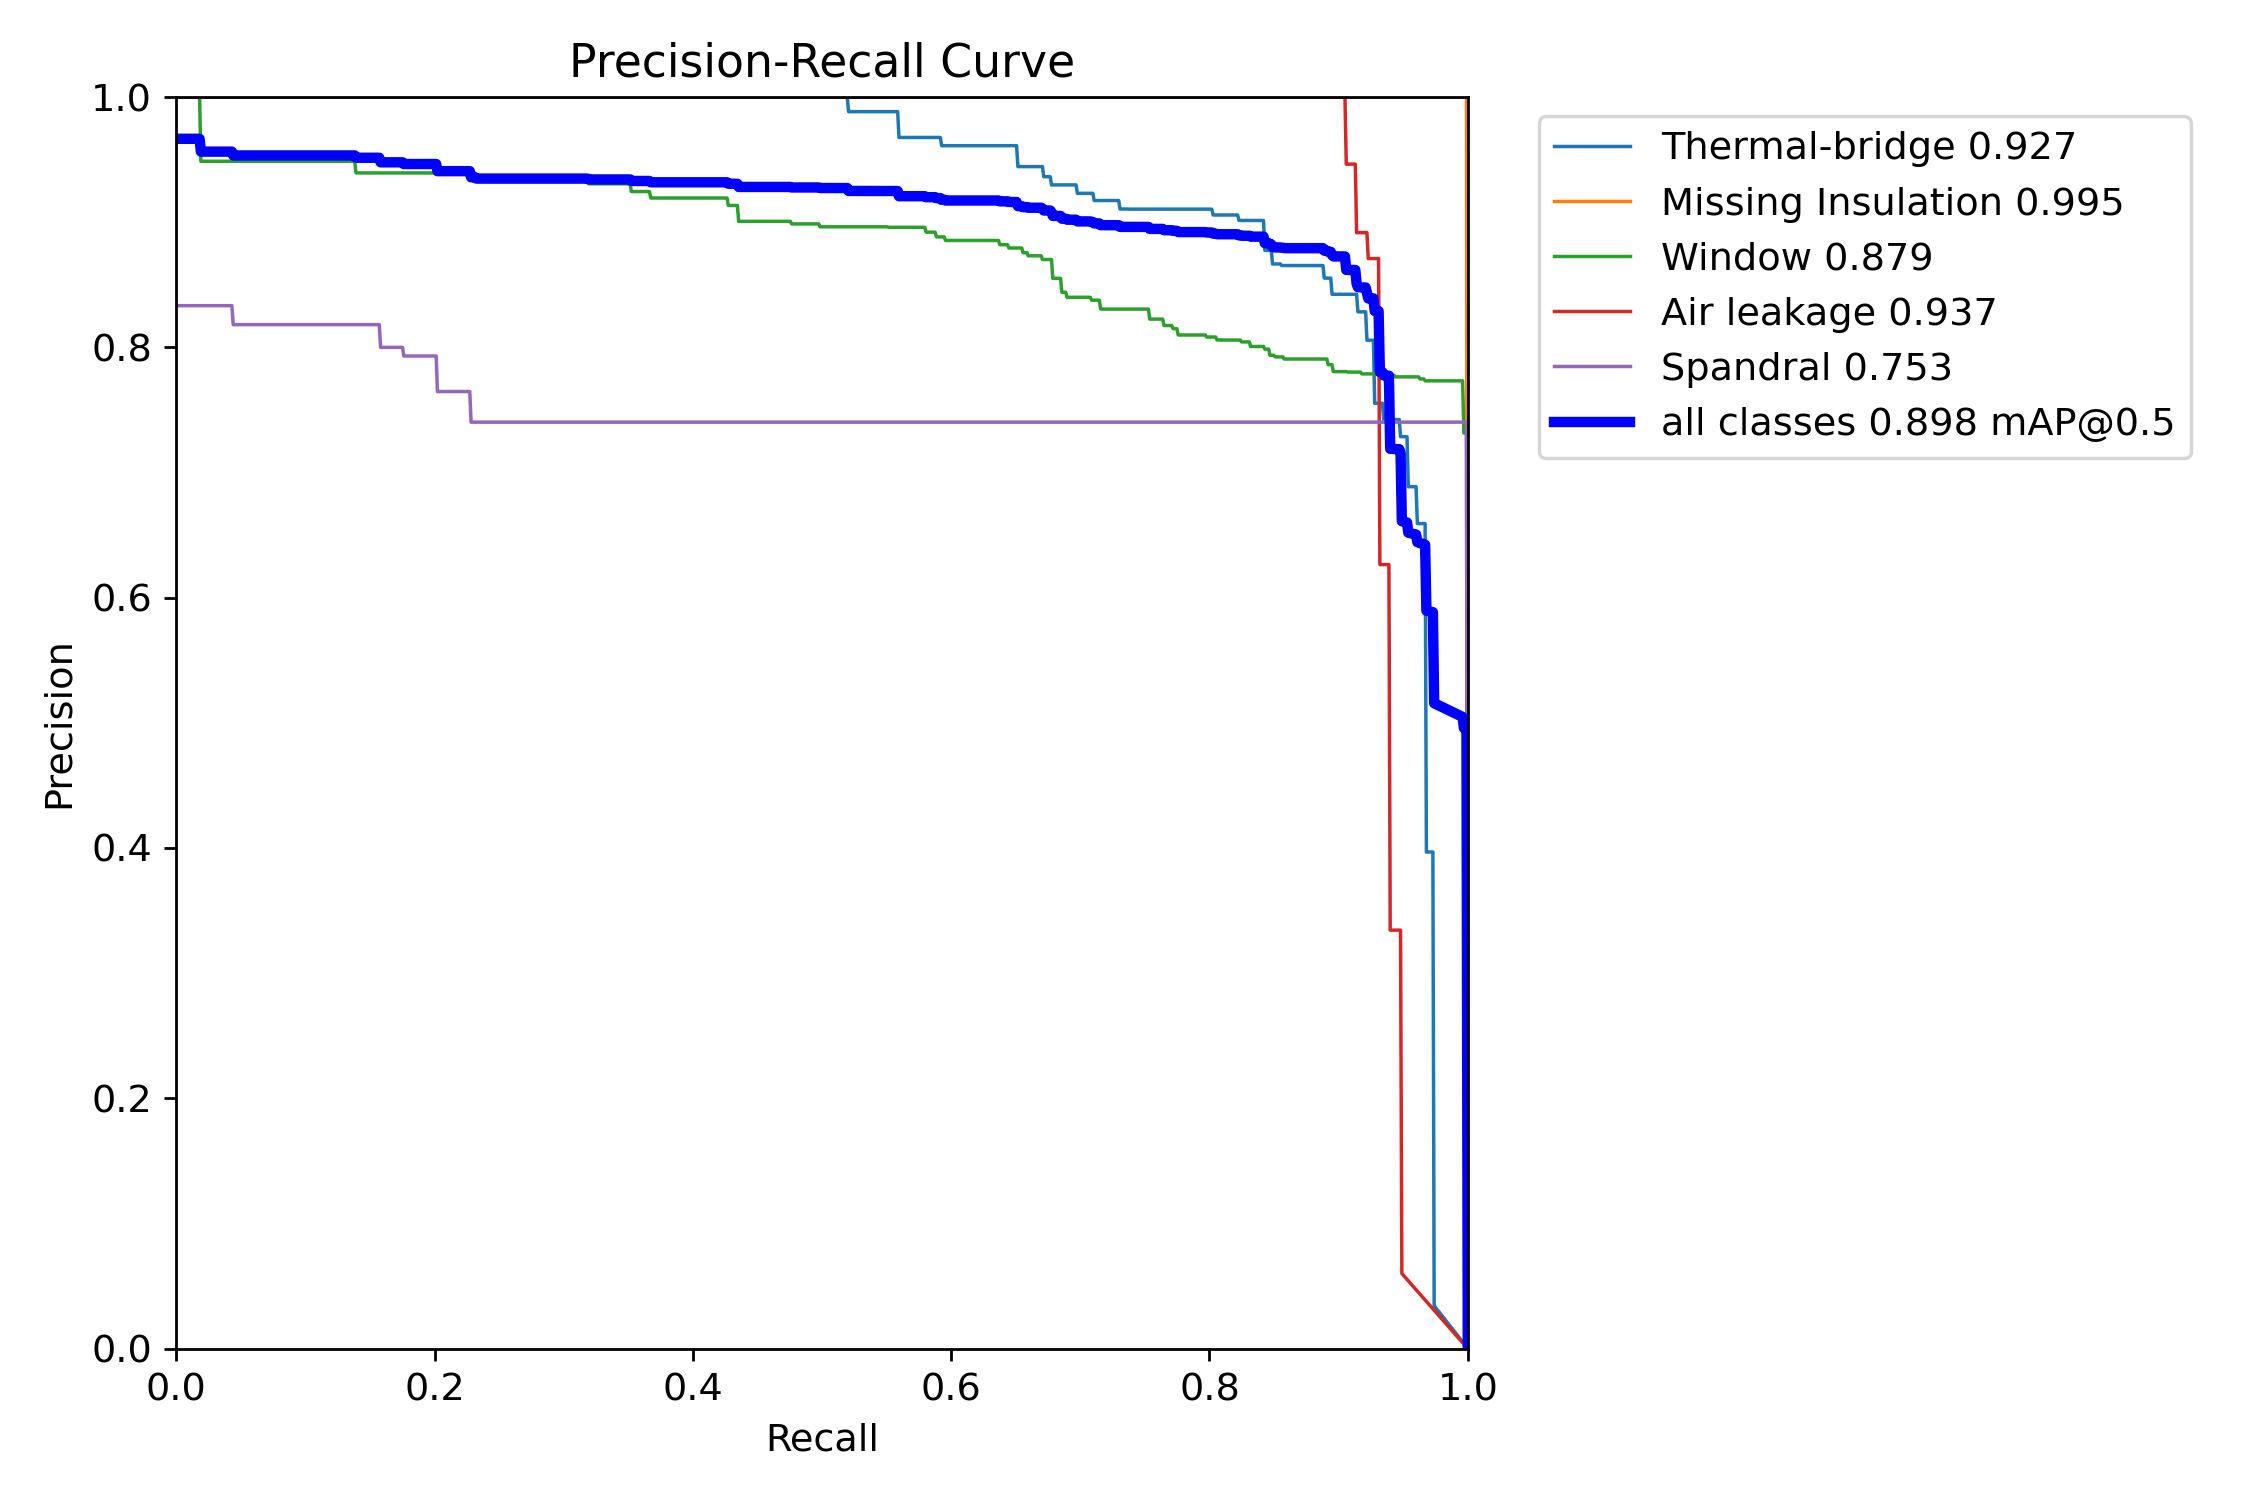
Fig. 5. Mask precision-recall curve Area under the curve is maximized across all significant classes, yielding 0.898 mAP@0.5 overall.

Stress-testing the result

Augmentation ablation

We retrained from scratch on the raw 24-image dataset with augmentation disabled, to quantify what the Albumentations pipeline was actually buying us.

mAP@50, augmented89.8%
mAP@50, raw baseline68.8% ↓21.0
Recall, augmented95.8%
Recall, raw baseline84.1% ↓11.7

Finding: the unaugmented network overfit badly and showed strong domain-locality bias. Radiometric and geometric augmentation is not a nicety on a dataset this size. It is what makes generalizable instance segmentation possible at all.

5-fold cross-validation

To rule out the possibility that 89.84% simply reflected a lucky 15% shuffle, we ran a programmatic 5-fold protocol over all 240 augmented images, an additional 500 epochs of training in total.

Mean mAP@5097.99% ±0.52
Mean recall95.68% ±1.39

Finding: the very small standard deviation across folds indicates the result is a property of the framework, not of a single favourable split. Note that because augmented variants of the same source image can land in different folds, these figures are optimistic relative to a strict source-level holdout. They demonstrate stability, and are reported alongside the single-split numbers rather than in place of them.

Ground truth vs. prediction

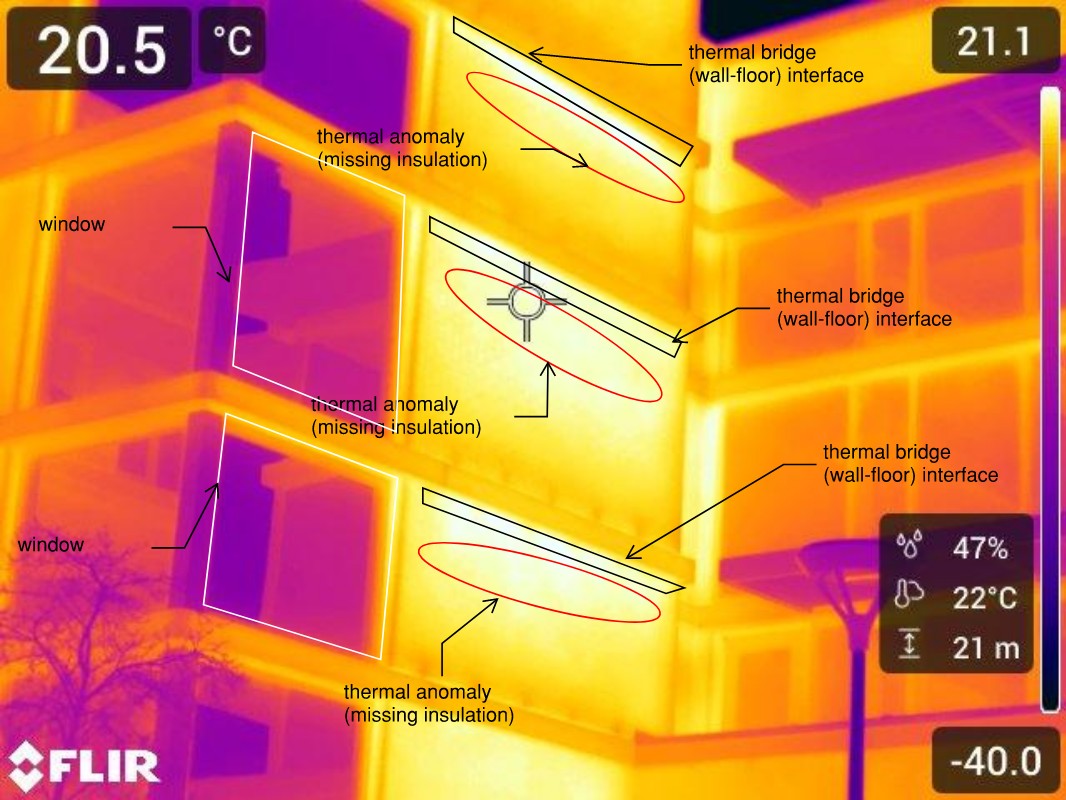
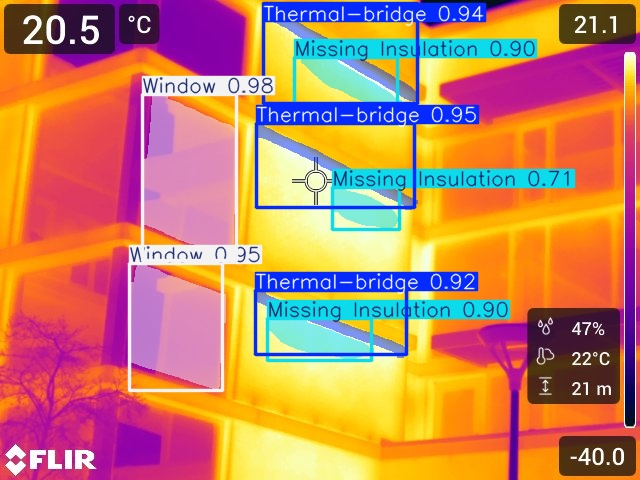
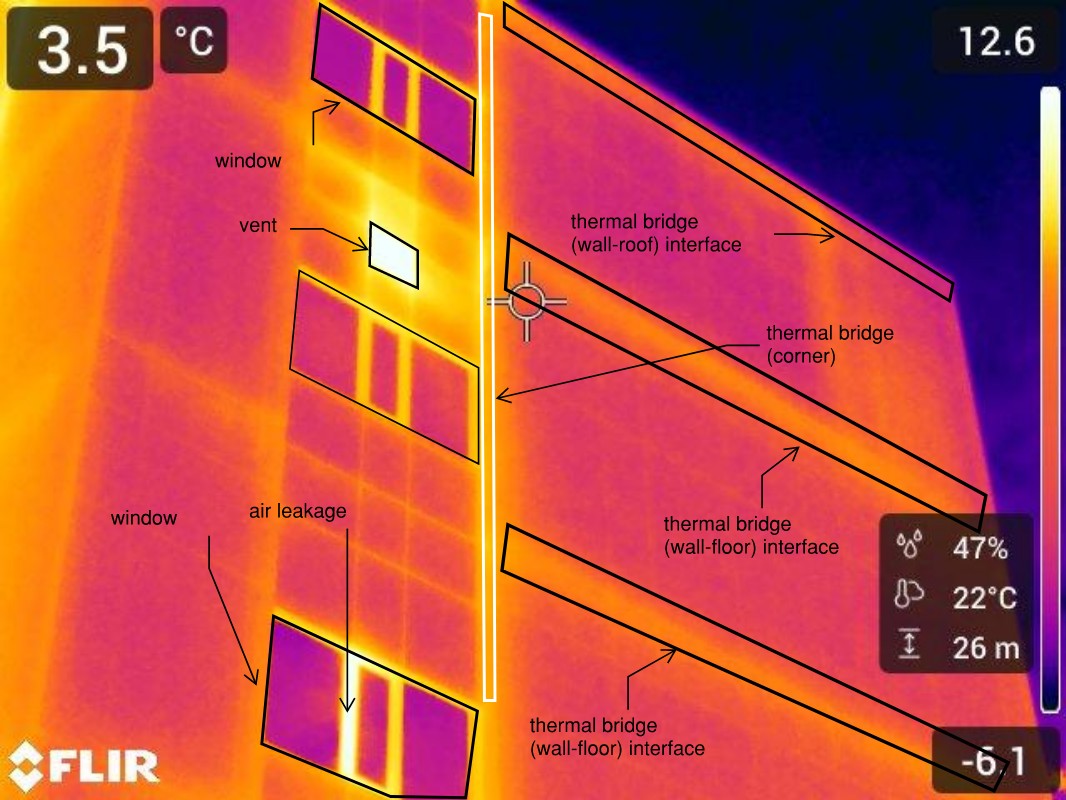
Expert-annotated thermograms on the left, autonomous YOLOv11n-seg output on the right, at an IoU threshold of 0.50.

Manually annotated thermogram IR_11489
Fig. 6. Ground truth IR_11489, expert annotation
Model prediction on thermogram IR_11489
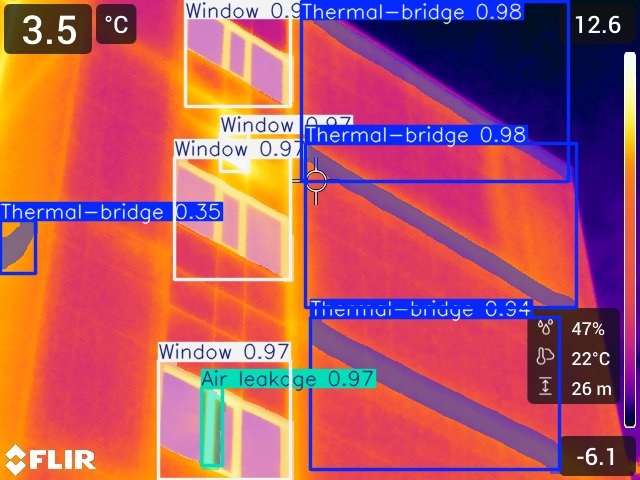
Fig. 7. Prediction IR_11489, YOLOv11n-seg
Manually annotated thermogram IR_12079
Fig. 8. Ground truth IR_12079, expert annotation
Model prediction on thermogram IR_12079
Fig. 9. Prediction IR_12079, YOLOv11n-seg

The visual comparison supports the quantitative metrics: the model segments complex anomaly geometries successfully, and overlap_mask=False lets it separate a localized thermal bridge from the window it borders. Where it differs from the human, it tends to draw tighter boundaries around diffuse thermal gradients, a consequence of cross-entropy optimization rather than human perceptual grouping.

Geographic & meteorological bias

Training data comes exclusively from University of Victoria buildings, so the learned thermal signatures are tied to Pacific Northwest construction and climate. Generalization to arid or severe-freezing environments is unverified.

Class ontology gaps

"Window" is the only structural reference class, and with no explicit training samples for exterior doors the network often misreads a door as a large window. Adding doors, pillars and roof seams would cut these false positives.

Small source dataset

24 source images augmented 10× is enough to demonstrate feasibility, but augmented variants of one source image can appear in both splits. Dataset expansion across building archetypes and seasons is the first item of future work.

References
  1. Balaras, C. A., & Argiriou, A. A. (2002). Infrared thermography for building diagnostics. Energy and Buildings, 34(2), 171–183.
  2. Fox, M., Coley, D., Goodhew, S., & De Wilde, P. (2014). Thermography methodologies for detecting energy related building defects. Renewable and Sustainable Energy Reviews, 40, 296–310.
  3. Jocher, G., et al. (2024). YOLO by Ultralytics [Software]. GitHub repository.
  4. Asdrubali, F., et al. (2018). Detection of Thermal Bridges from Thermographic Images by Means of Image Processing Approximation Algorithms. Applied Mathematics and Computation, 317, 160–171.
  5. De Filippo, M., Asadiabadi, S., Ko, N., & Sun, H. (2019). Concept of Computer Vision Based Algorithm for Detecting Thermal Anomalies in Reinforced Concrete Structures. 15th AITA Workshop, Florence, Italy.
  6. Mirzabeigi, S., Razkenari, M., & Crovella, P. (2024). Automated Thermal Anomaly Detection through Deep Learning-Based Semantic Segmentation of Building Envelope Images. Computing in Civil Engineering 2023, ASCE.
  7. Dehghani, M., et al. (2024). Deep learning based semantic segmentation for thermal anomaly detection in building facades using infrared thermography. Energy and Buildings, 316, 114389.
  8. Mahmoodzadeh, M., Gretka, V., Wong, S., Froese, T., & Mukhopadhyaya, P. (2020). Evaluating Patterns of Building Envelope Air Leakage with Infrared Thermography. Energies, 13(14), 3545.
  9. Mahmoodzadeh, M., Gretka, V., Blue, A., Adams, D., Dallimore, B., & Mukhopadhyaya, P. (2021). Evaluating thermal performance of vertical building envelopes: Case studies in a Canadian university campus. Journal of Building Engineering, 40, 102712.
  10. Mahmoodzadeh, M., Gretka, V., Hay, K., Steele, C., & Mukhopadhyaya, P. (2021). Determining overall heat transfer coefficient (U-Value) of wood-framed wall assemblies in Canada using external infrared thermography. Building and Environment, 199, 107897.
  11. Mahmoodzadeh, M., Gretka, V., Lee, I., & Mukhopadhyaya, P. (2021). Utilizing External Infrared Thermography to Assess Thermal Performance of Wood-Framed Building Envelopes in Canada. Energy and Buildings, 111807.
05 / Acknowledgment

*thank
you

This project only exists because people with far more expertise than us were generous with their time, their data and their judgment.

Project supervisor

Dr. Phalguni Mukhopadhyaya, P.Eng.

Department of Civil Engineering, University of Victoria. For his continuous guidance, his domain expertise in building envelope science, and his support throughout the duration of this project.

Domain expertise & annotation

Dr. Milad Mahmoodzadeh

Ph.D., Civil Engineering, University of Victoria. For contributing his expert knowledge of building envelope thermal performance to the definition and verification of the ground-truth dataset annotations. The dataset's credibility rests on this work.

Equipment & imagery

UVic Department of Civil Engineering

For providing access to the FLIR A65 thermal camera and the thermographic survey imagery of campus buildings used to construct the dataset.

Department, and those who put up with us

UVic Electrical & Computer Engineering

With thanks to the technical staff and teaching assistants of the Department of Electrical and Computer Engineering for their assistance throughout the project, and to our families and friends for their patience and encouragement. Thanks also to the maintainers of the open-source projects this work is built on: Ultralytics YOLO, PyTorch, Albumentations and Flask.

06 / Final report

*the
report

The complete written report, plus the conference-format research poster presented alongside it.

Infrared Image Recognition and Iterative Supervision (IIRIS)

  • AuthorsJohn Soliman · Yunu Choe
  • SupervisorDr. Phalguni Mukhopadhyaya, P.Eng.
  • CourseECE 499 · Design Project II
  • InstitutionUniversity of Victoria
  • DateAugust 2026
  • Length24 pages
  • ContentsObjectives · Design specifications · Literature survey · Methodology · Testing & validation · Cost analysis · EGBC ethics appendix

Research poster

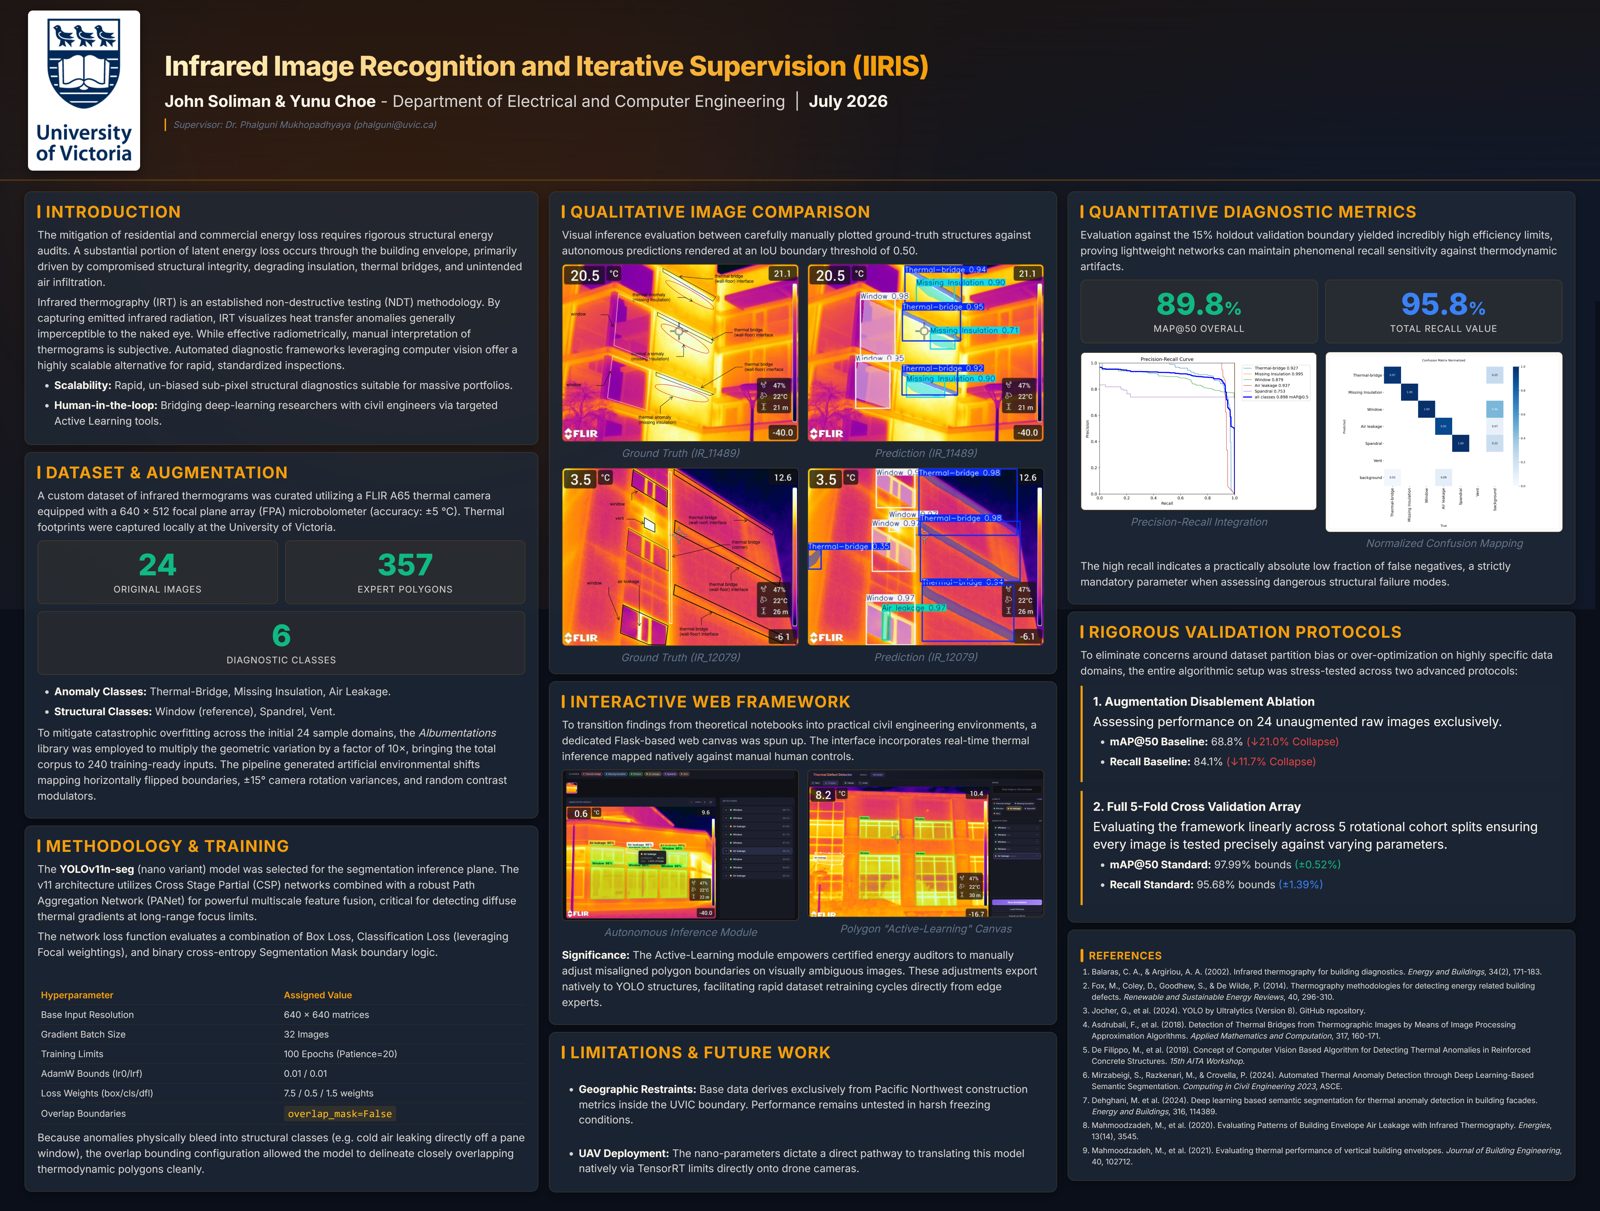
Presented at 4 ft × 3 ft. Click through for the full-resolution PDF.

IIRIS research poster: Infrared Image Recognition and Iterative Supervision
Conference poster Open the PDF for the print-resolution version.